Insights and Governance Reports
Use aggregate adoption and risk views to identify where investigation should begin, then drill into underlying users, AI assets, accounts, and findings.
Navigation: Insights > AI Insights or Governance Reports.
Configuration and options: AI Insights exposes a date range plus adoption, department, sensitive-data, user, app, category, and approval-status widgets. Governance Reports exposes Summary Dashboard, Incident Table, and Executive Summary.
Role-specific value: Administrators use trends and governance summaries for program oversight; Engineers use drill-down links and incident filters to build an investigation queue.
Verification: A dashboard observation can be reproduced in the underlying User, AI Asset, Account, or Finding records for the same time range.
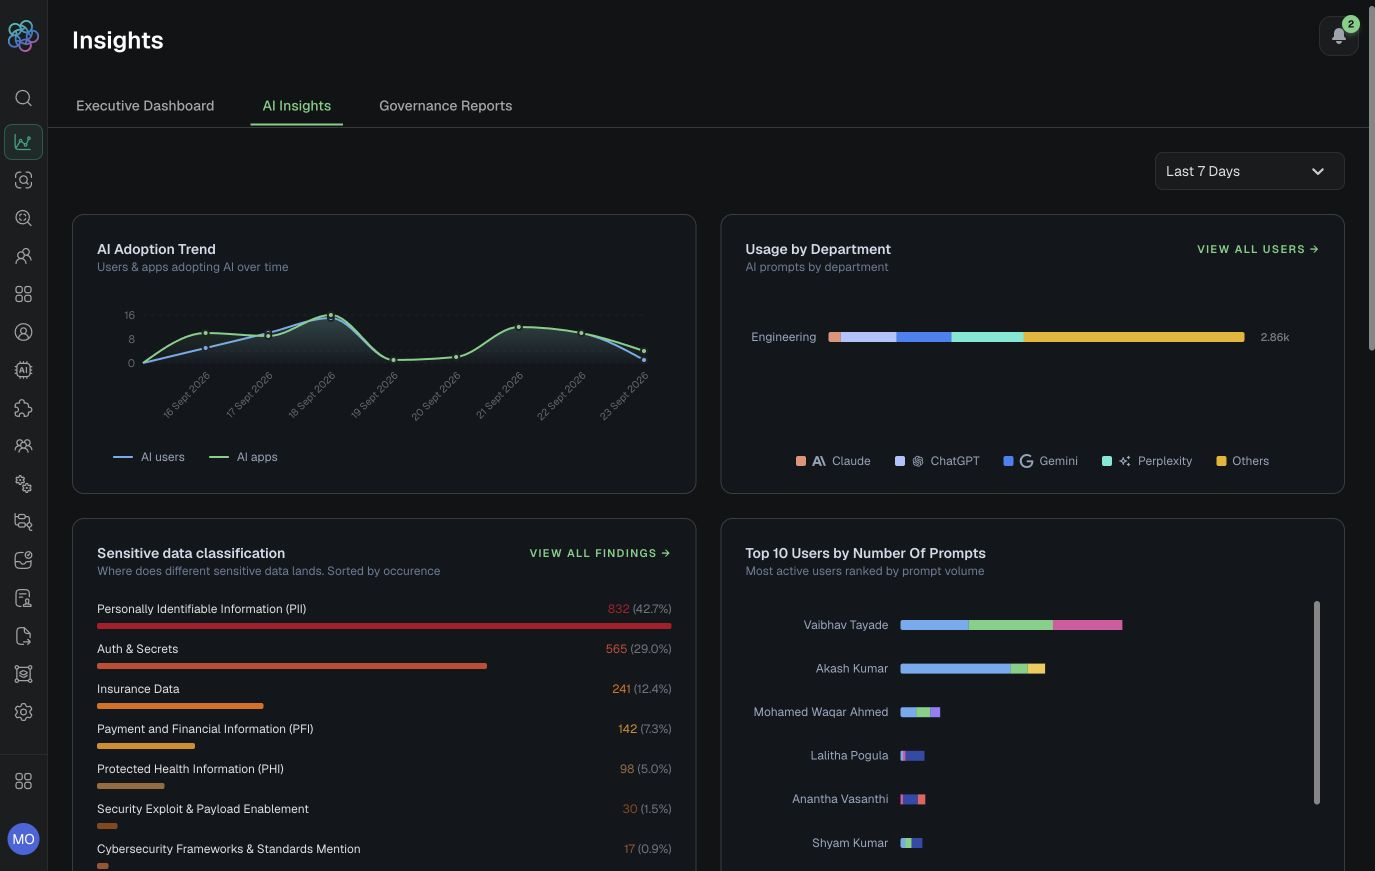
Populated AI Insights overview with adoption, department, sensitive-data, and user widgets.
AI Insights walkthrough
-
Set the date range before comparing widgets.
-
Review AI Adoption Trend for changes in participating users and AI services or assets.
-
Use Usage by Department and View All Users to identify who is driving activity.
-
Use Sensitive data classification and View All Findings to pivot from category counts to evidence.
-
Review Top Users, Top AI Apps, Categories of AI Apps, and approval status; pivot to AI Assets for current inventory detail because Applications is end-of-life.
-
Treat “Not enough data” as a data-availability condition for the selected window, not a zero-risk result.
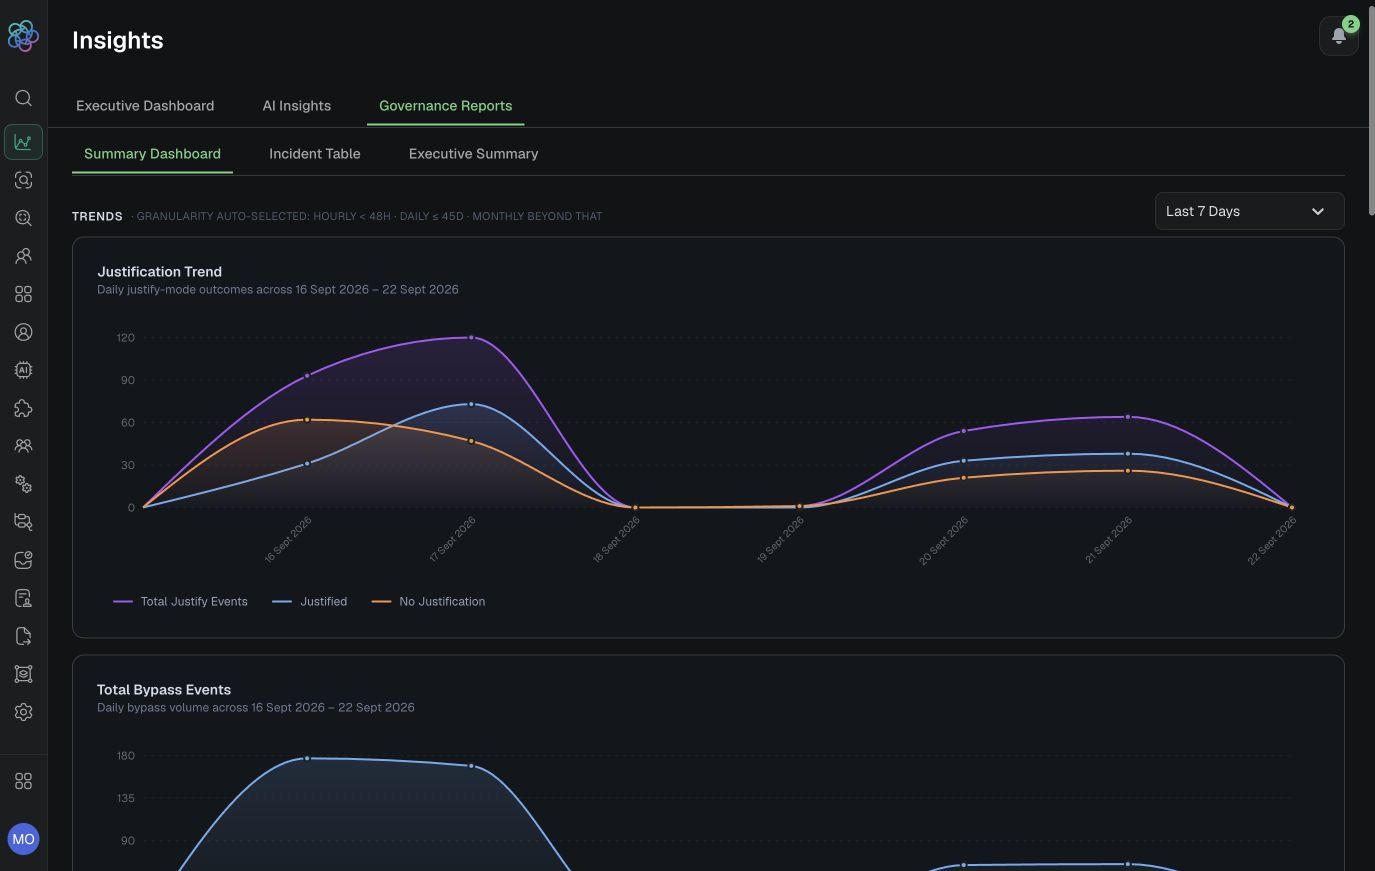
Populated Governance Reports Summary Dashboard with justification and bypass trends.
Governance Reports walkthrough
-
Summary Dashboard: choose date range and granularity; review justification trend, total bypass events, key metrics, sensitive-data breakdown, domain activity, and user response.
-
Incident Table: search by email/finding ID and filter risk level or justification status for the selected date range.
-
Executive Summary: use the generated narrative as a reporting aid, then validate its statements against dashboard metrics and underlying incidents.
Exports: The guide does not establish a direct Export control on AI Insights or Governance Reports. Use supported Users, Findings, or Audit Log exports to preserve reproducible evidence.
Expected result: The team can explain which widget triggered the investigation and reproduce it in detailed records.
Verification: Keep the same date range while pivoting, then confirm users, AI assets, classifications, and findings reconcile with the aggregate view.
Use the end-to-end workflow to investigate a signal from these reports.