Findings & Interactions
Findings & Interactions is the one place to see what people did with AI and what Quilr flagged along the way. Open it from Observe > Findings & Interactions in the sidebar.
Use it to:
- review findings that may need your attention,
- look up everything a person or an application did with AI in a period,
- open a single conversation and see exactly what happened,
- export a filtered list for a report or an audit.
To close findings in bulk, see the Triage center.
Findings and Interactions
The two tabs at the top of the page are two ways of looking at the same activity.
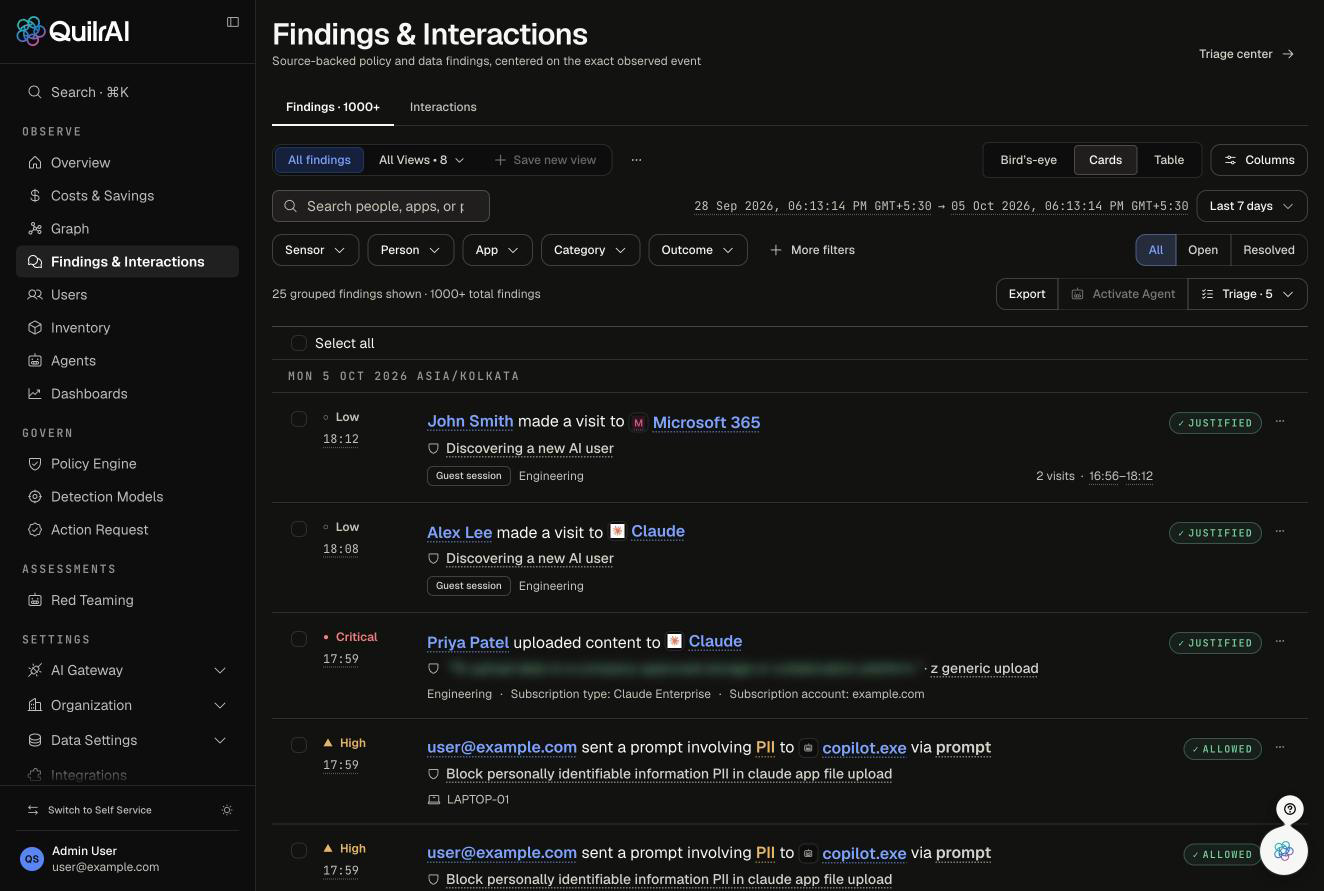
Each finding card reads as one sentence: who did what, in which app, under which policy, and what happened (for example Allowed, Justified or Blocked). The severity and the time sit on the left.
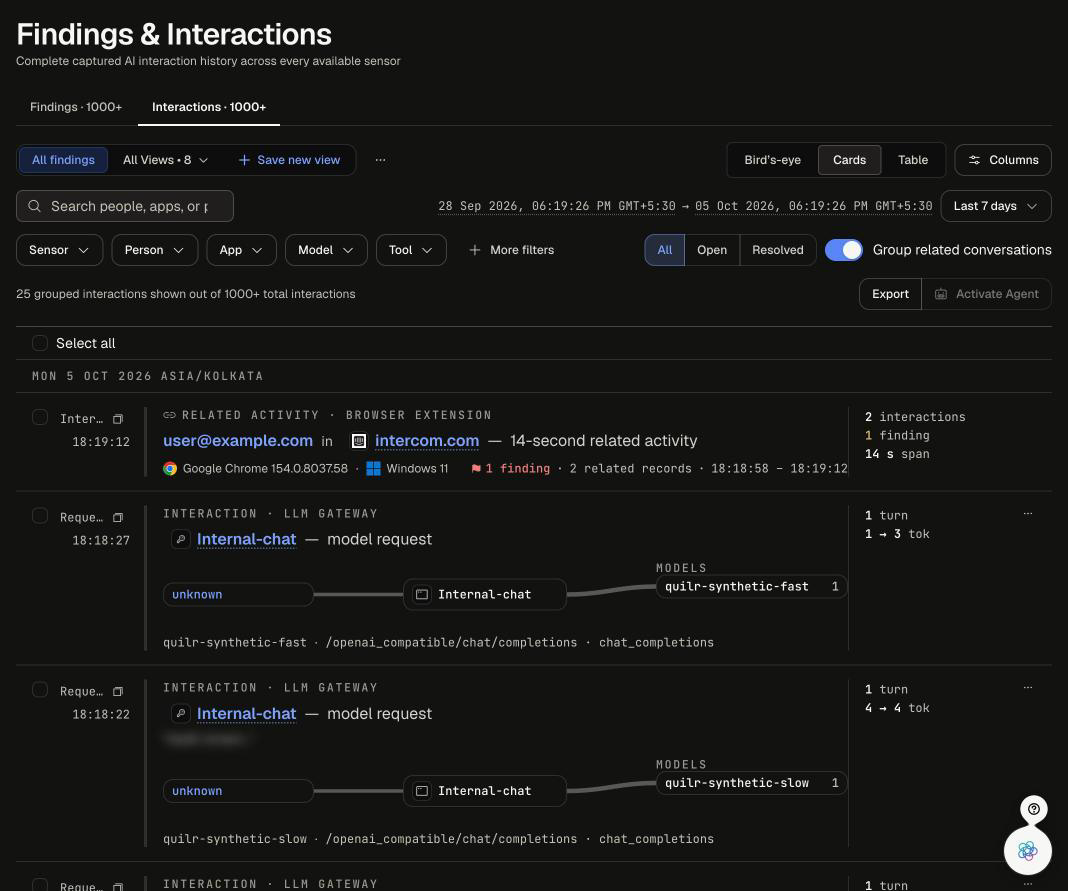
On the Interactions tab, turn on Group related conversations to fold related records (for example several prompts in one short session) into a single row.
Choose a layout
Switch layouts with the Bird's-eye, Cards and Table buttons at the top right. Filters and the period carry across all three.
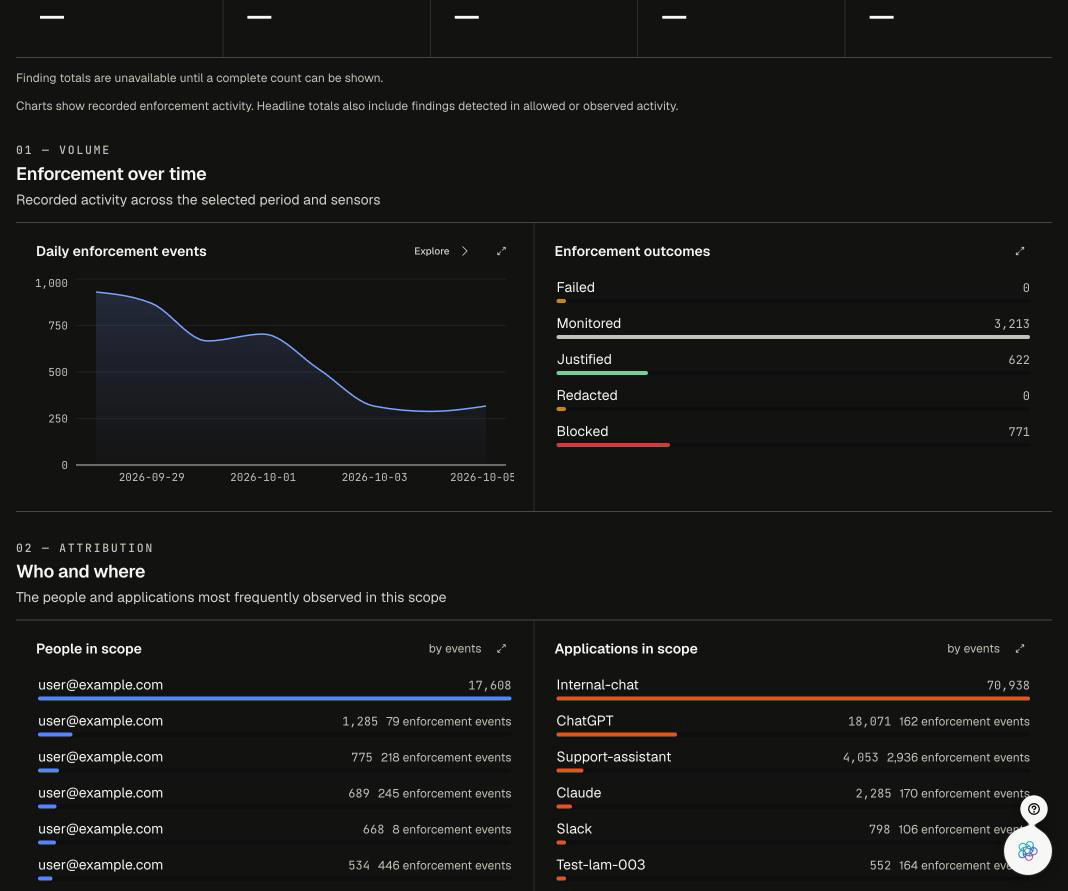
- Bird's-eye - summary totals, enforcement over time, enforcement outcomes, and the people and applications that appear most often. Use it to spot trends before you drill into rows.
- Cards - one readable card per finding or interaction. Best for reviewing a queue.
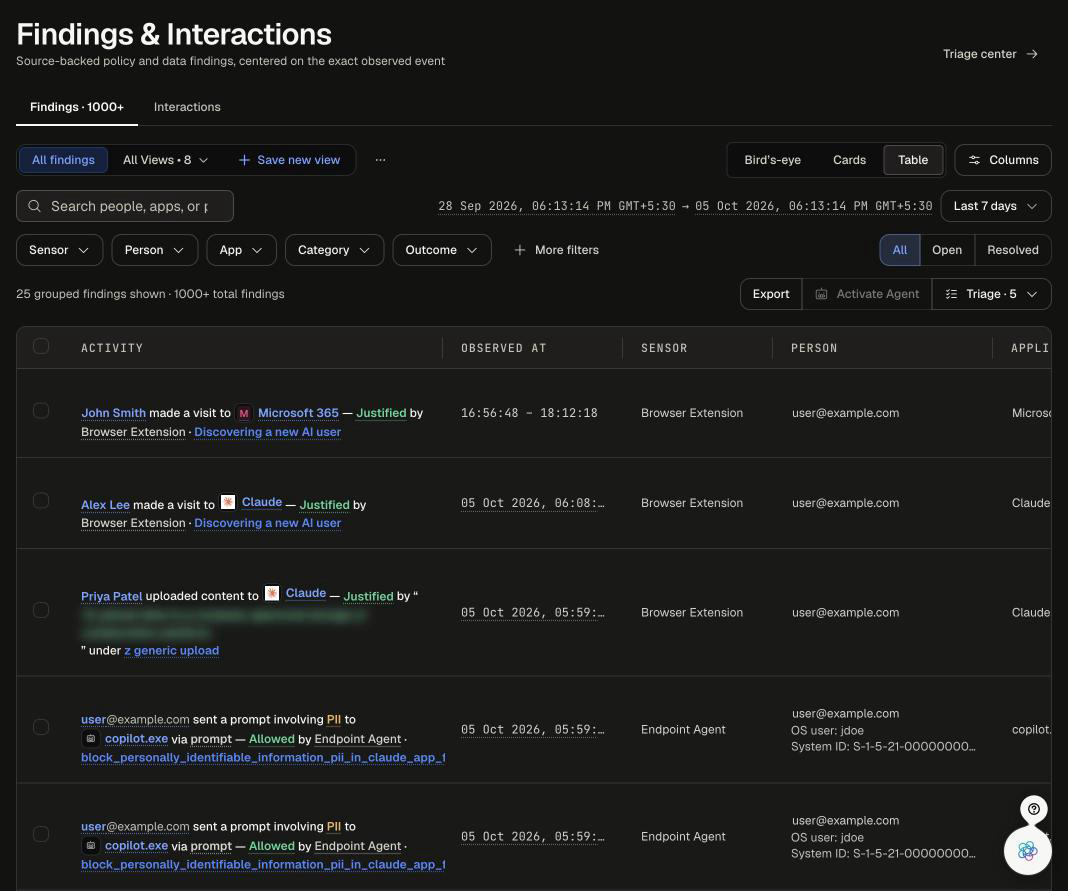
- Table - one row per item with sortable columns. Use Columns to choose which columns you see.
Filter the list
- Pick a period from the date menu at the top right (for example Last 7 days). Every count on the page follows it.
- Type in the search box to find a person, an application or a policy.
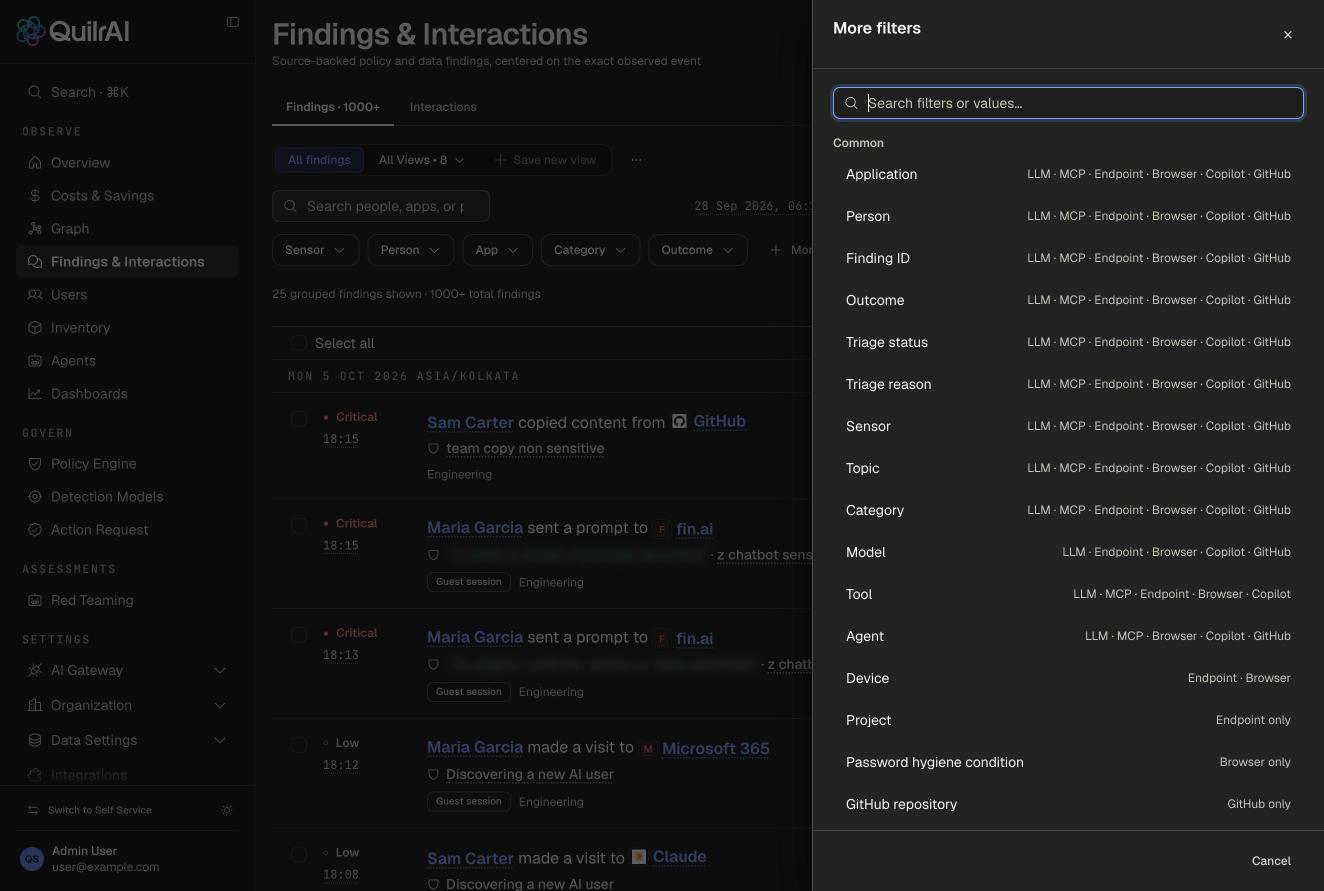
- Use the quick filters under the search box. On Findings these are Sensor, Person, App, Category and Outcome. On Interactions they are Sensor, Person, App, Model and Tool.
- Click More filters for the full list, including Triage status, Triage reason, Topic, Agent and Device. Each filter shows which sensors it applies to.
- Use the All, Open and Resolved toggle to show findings by triage state. Open is the queue that still needs a decision.
Save a view
When you use the same filters often, click Save new view. Saved views keep the filters, columns and layout, and appear under All Views so you can return to them in one click.
Investigate a conversation
Click any card or row to open the investigation drawer. The drawer opens over the list, so you keep your place.
-
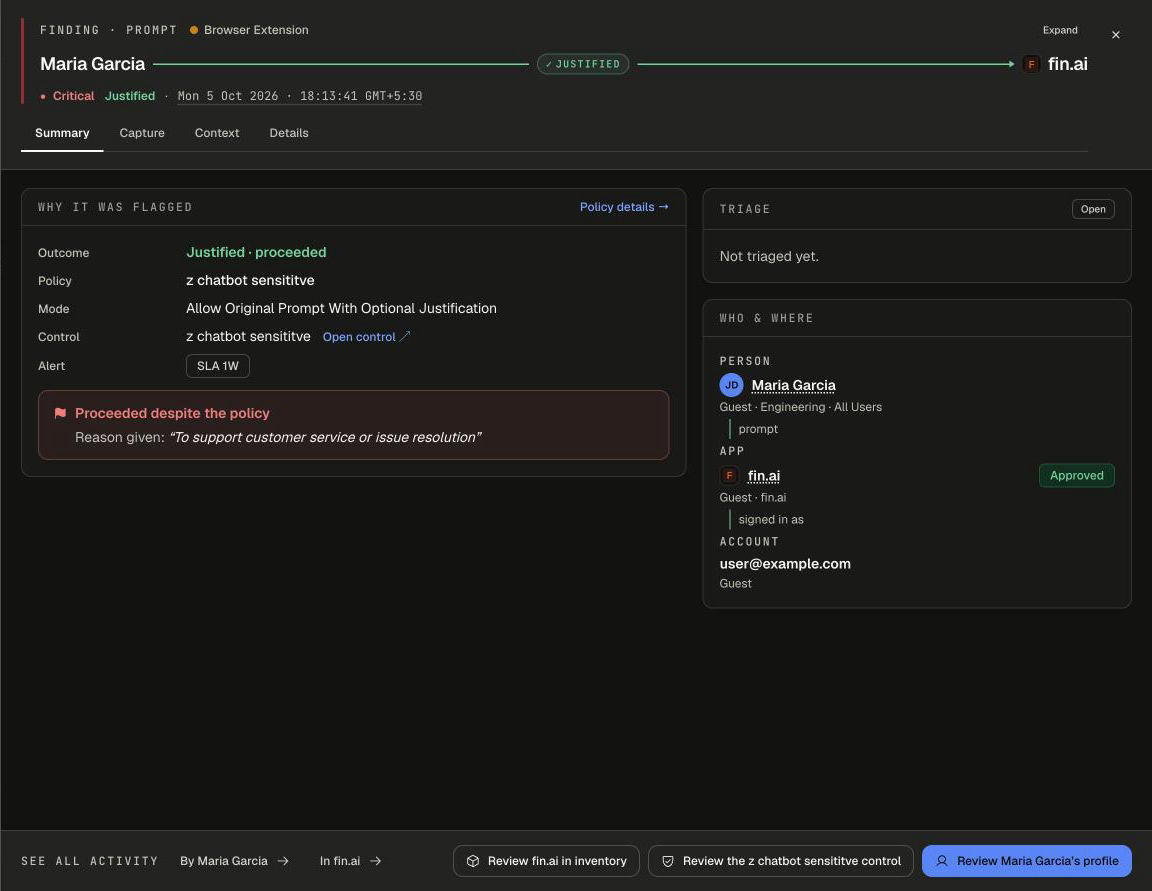
Read the Summary tab first. Why it was flagged names the outcome, the policy and control that applied, and any reason the person gave. Triage shows whether the finding is still open or how it was closed. Who & where names the person, the application and the account used.
-
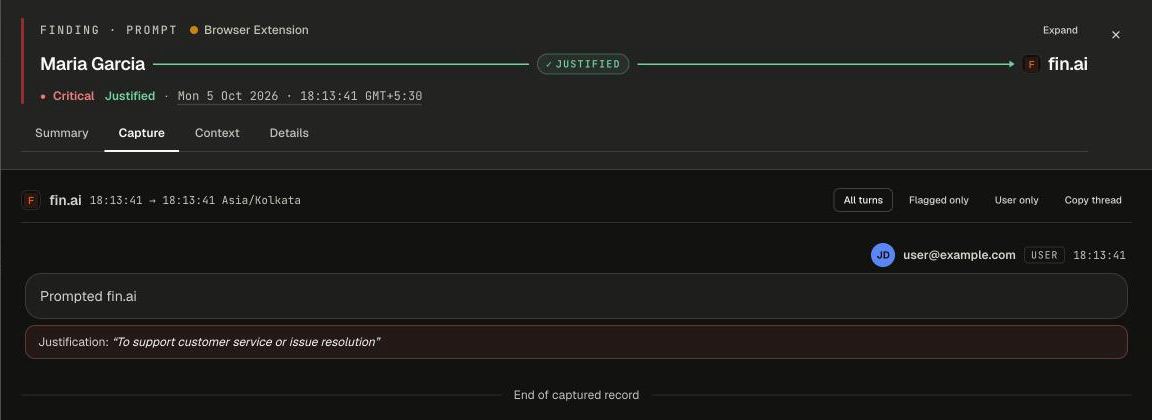
Open the activity tab to replay what happened. Its name follows the sensor: Capture for the browser, Prompts & completions for the LLM Gateway, Tool calls for the MCP Gateway and Agent activity for the Endpoint Agent. Use All turns, Flagged only or User only to focus, and Copy thread to copy it.
-
Open Context for the person's recent history, their top apps and controls, and the client and device the activity came from.
-
Open Details for the identifiers you may need when you raise a ticket.
-
Use the buttons along the bottom to keep going: see all activity by the same person or in the same app, review the app in Inventory, open the control, or open the person's profile.
Click Expand at the top of the drawer to view a long conversation full screen.
Export and other actions
- Export sends the list you are looking at, with its filters, to the Export Center so you can download it.
- Triage (next to Export) opens the Triage center and shows how many suggestions are waiting.
Next steps
- Triage center - close findings that no longer need action
- Detection tuning - stop the same false positives from being raised again