Overview

The LLM Gateway sits between your applications and your LLM providers. Your code keeps its SDK. You change the base URL and the API key, and every request is checked by guardrails, routed to a provider, and logged with cost and latency.

Your application
OpenAI, Anthropic, boto3 or Google SDK
Sends a Quilr key
QuilrAI LLM Gateway
Guardrails on request and response
Routing, limits, token saving
Logs, cost, health
Your provider
OpenAI, Anthropic, Azure
Bedrock, Vertex AI, Oracle OCI
Any OpenAI-compatible URL
QuilrAI

Key concepts​

TermWhat it is
Application (app)The unit you configure. An app holds its providers, guardrails, routing, limits, prompts and logs. You create one with Create App.
Quilr keyThe credential your code sends to the gateway. An app can have several named Quilr keys, each with its own expiry. See Applications and Keys.
ProviderAn upstream connection: a provider type (for example openai or bedrock), its credentials, a label, and the models the app may call. See Provider Support.
Primary and additional providersAn app can use several providers. The first is the primary; the rest serve failover, routing groups and explicit provider selection.
Global providerA provider set up once in Settings > Models and linked to many apps (V2 console only). See Providers and Models.

Provider credentials stay in the gateway. Developers only ever see the Quilr key.

The LLM Gateway page​

Go to Settings > LLM Gateway. The page has two tabs: Applications and Management API (see Management APIs).
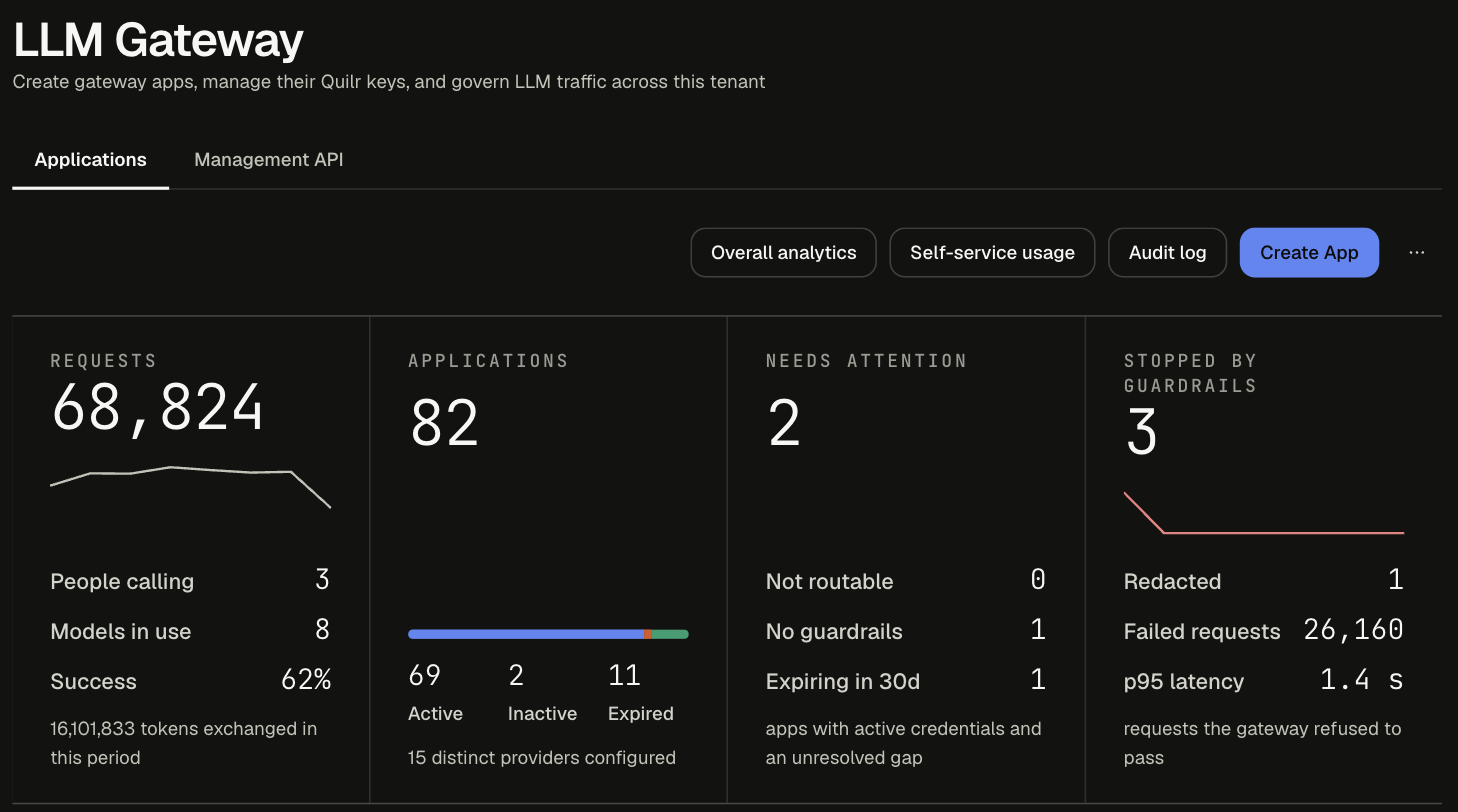
LLM Gateway Applications tab with the Overall analytics, Self-service usage, Audit log and Create App buttons above four summary cards

ButtonWhat it opens
Overall analyticsThe gateway workspace for all applications, on the Analytics tab
Self-service usageWho can use self-service in each app, and whether they do
Audit logThe gateway workspace on its Audit tab
Create AppThe Create App wizard. See Quick Start.
...Copy all-apps log key, a read-only key for the Log Export API across every app
Summary cardShows
RequestsRequest count, people calling, models in use, success rate, tokens exchanged
ApplicationsActive, Inactive and Expired apps, and the number of distinct providers
Needs attentionApps that are not routable (every provider off), have no guardrails, or have a key expiring in 30 days
Stopped by guardrailsBlocked and redacted requests, failed requests, p95 latency

Click any number on a card to filter the app list. Below the cards, search by app, key, provider, model, creator or tag, and filter by attention, status or provider.

The app card​

Each app in Configured Apps has a card.
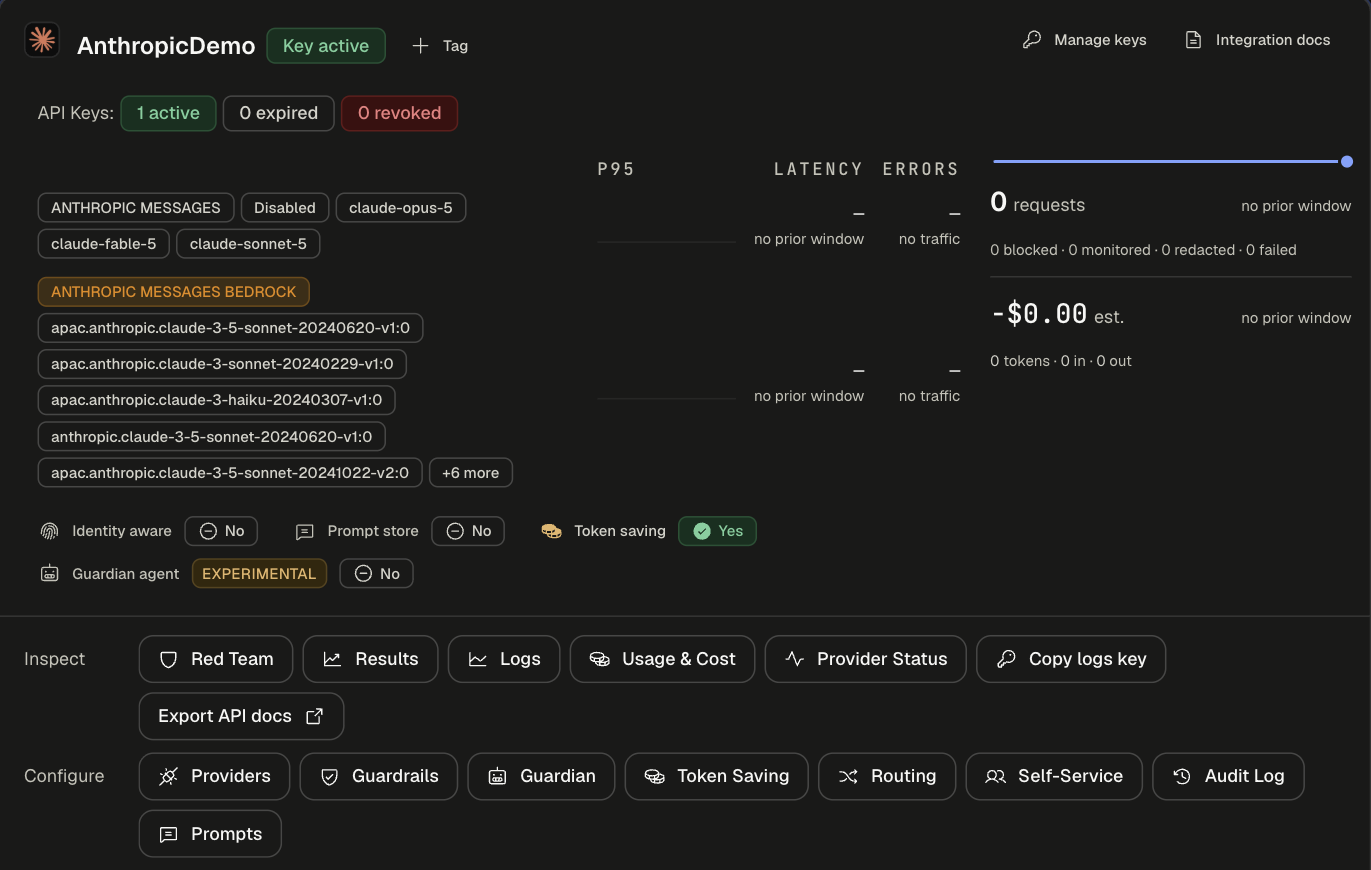
App card with its providers and models, feature chips, request and cost summary, and the Inspect and Configure button rows

AreaWhat it shows
HeaderApp name, key status, + Tag, Manage keys, Integration docs
API KeysActive, expired and revoked Quilr key counts
ProvidersEach provider with its models, a Disabled chip if switched off, and its p95, latency and error trend
Feature chipsIdentity aware, Prompt store, Token saving, Guardian agent
TrafficRequests, blocked, monitored, redacted and failed counts, estimated cost, tokens
InspectRed Team, Results, Logs, Usage & Cost, Provider Status, Copy logs key, Export API docs
ConfigureProviders, Guardrails, Guardian, Token Saving, Routing, Self-Service, Audit Log, Prompts

The app workspace​

Every Inspect and Configure button opens the app workspace on the matching tab. Overall analytics opens the same workspace with All applications selected. Switch scope with the application picker.
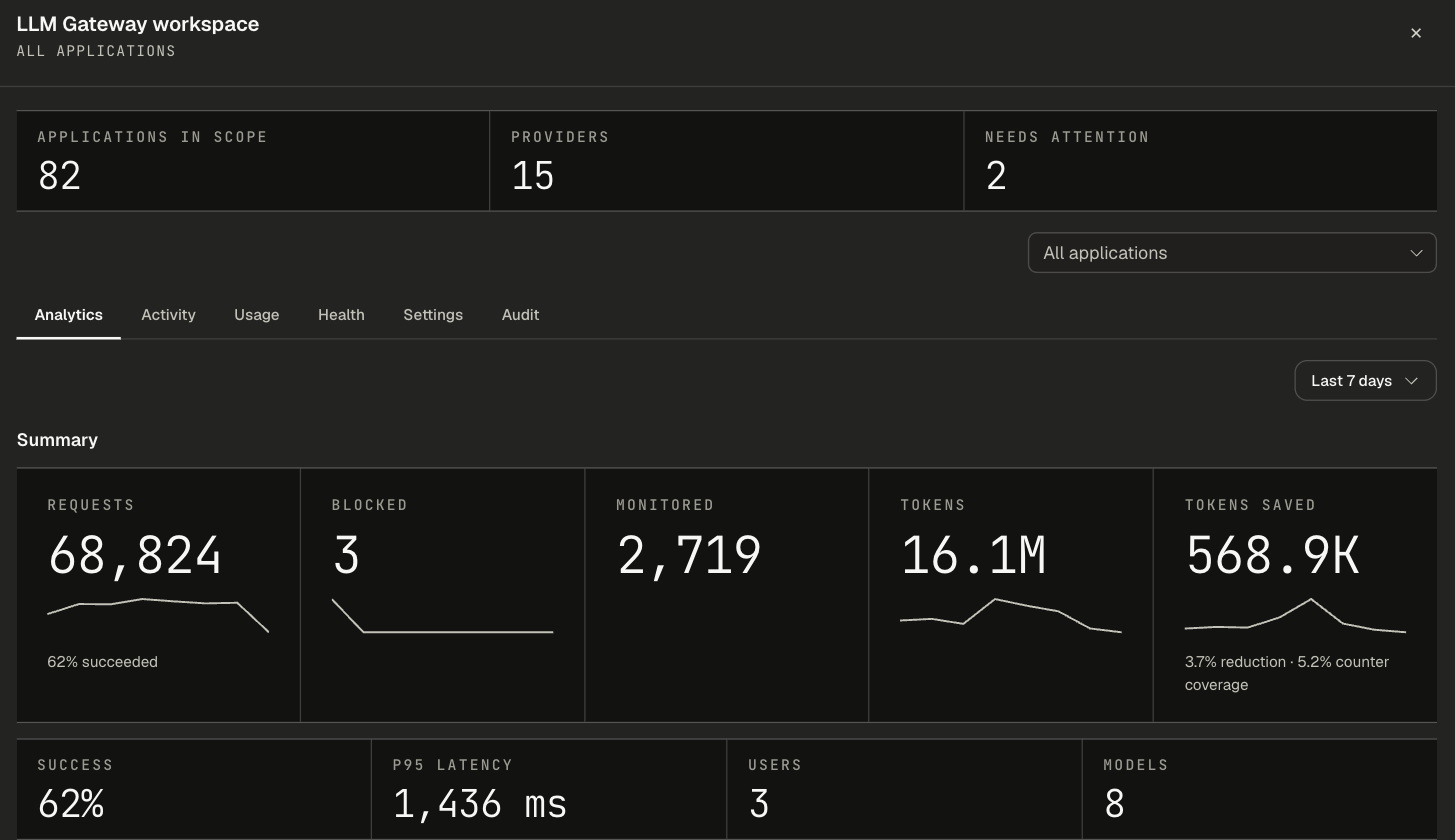
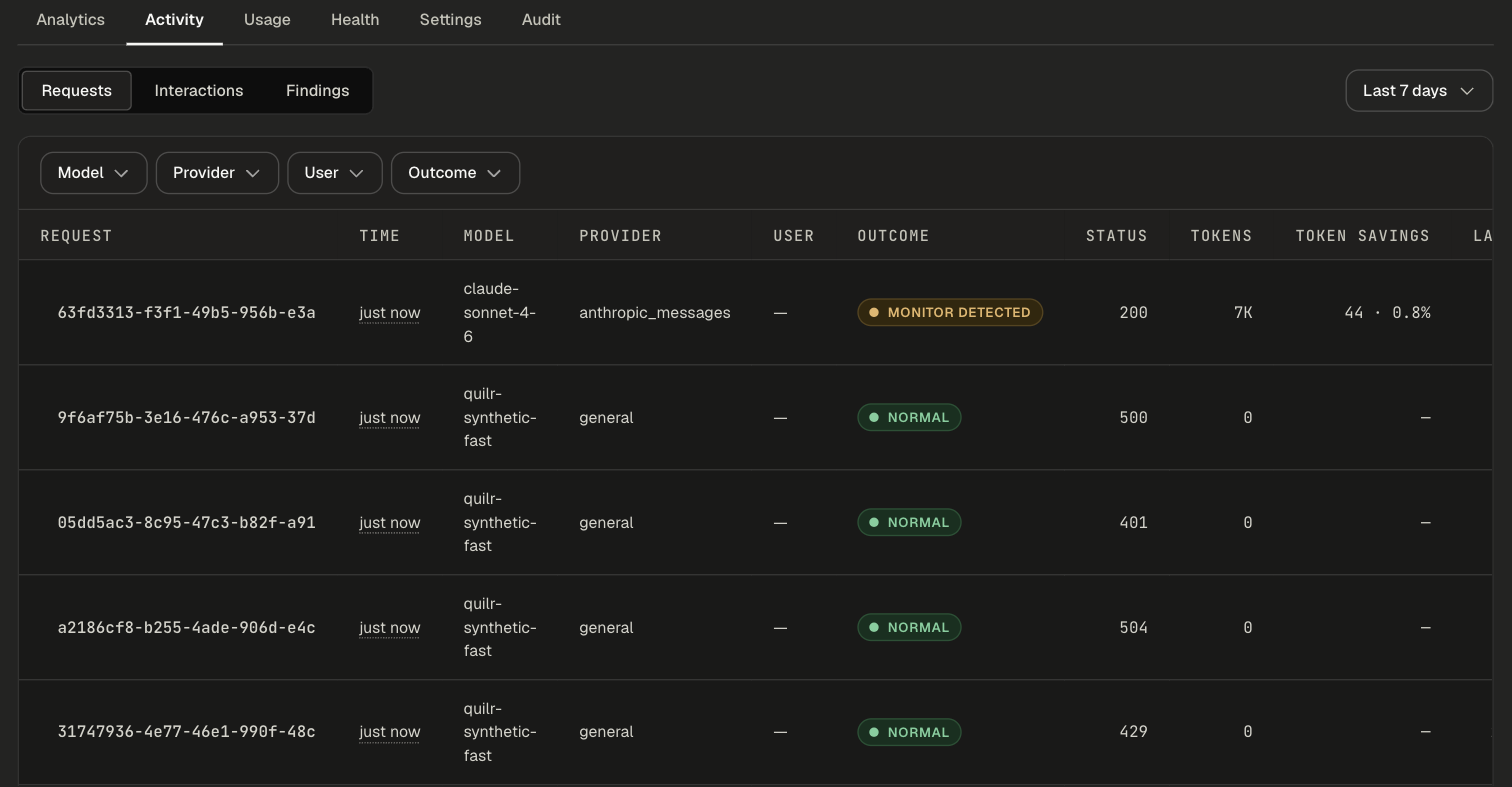
TabWhat it shows
AnalyticsRequests, blocked, monitored, tokens and tokens saved; traffic by model; guardrail outcomes; top users; requests by provider
ActivityRequests (one row per call), Interactions (calls grouped into conversations) and Findings (guardrail detections)
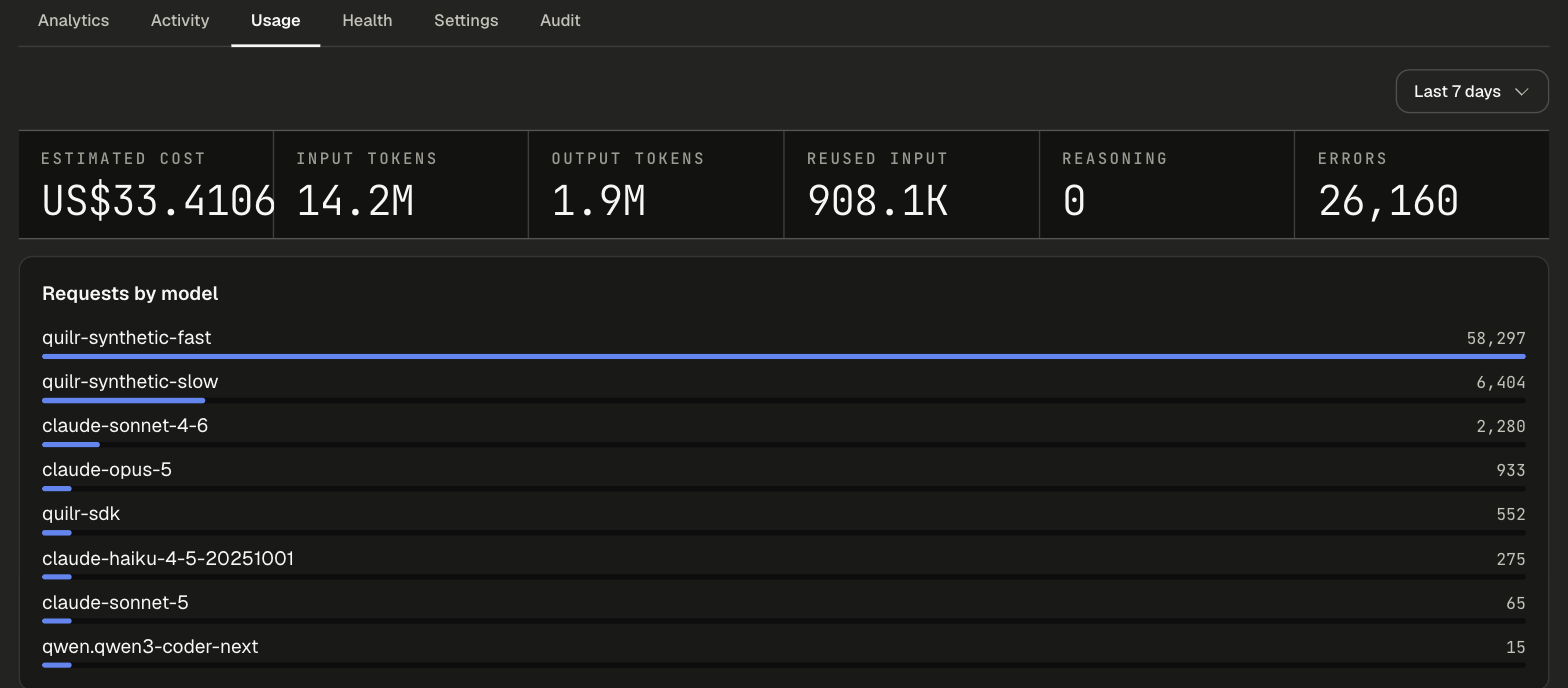
UsageEstimated cost, input, output, reused and reasoning tokens, errors, and requests and tokens by model
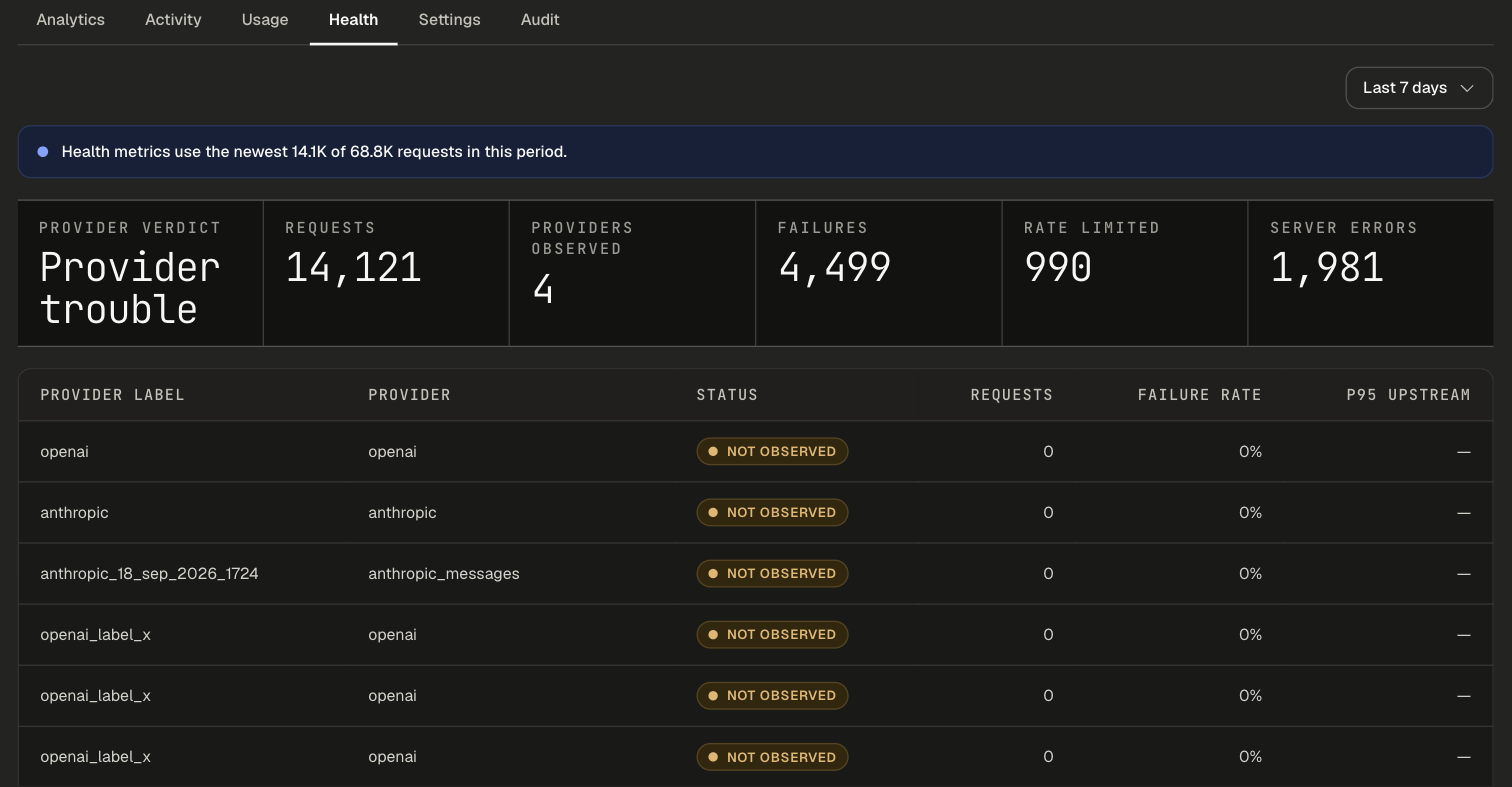
HealthProvider verdict, failures, rate limits and server errors, and failure rate and p95 upstream latency per provider
SettingsThe app configuration. Available for one app at a time.
AuditConfiguration changes: application, operation, actor, status and time

Analytics tab of the LLM Gateway workspace showing request, blocked, monitored, token and tokens-saved summaries

Activity tab, Requests view, listing each request with model, provider, outcome, HTTP status, tokens, token savings and latency

Usage tab with estimated cost, token tiles and requests by model

Health tab with the provider verdict, failure tiles and a per-provider status table

Settings sections​

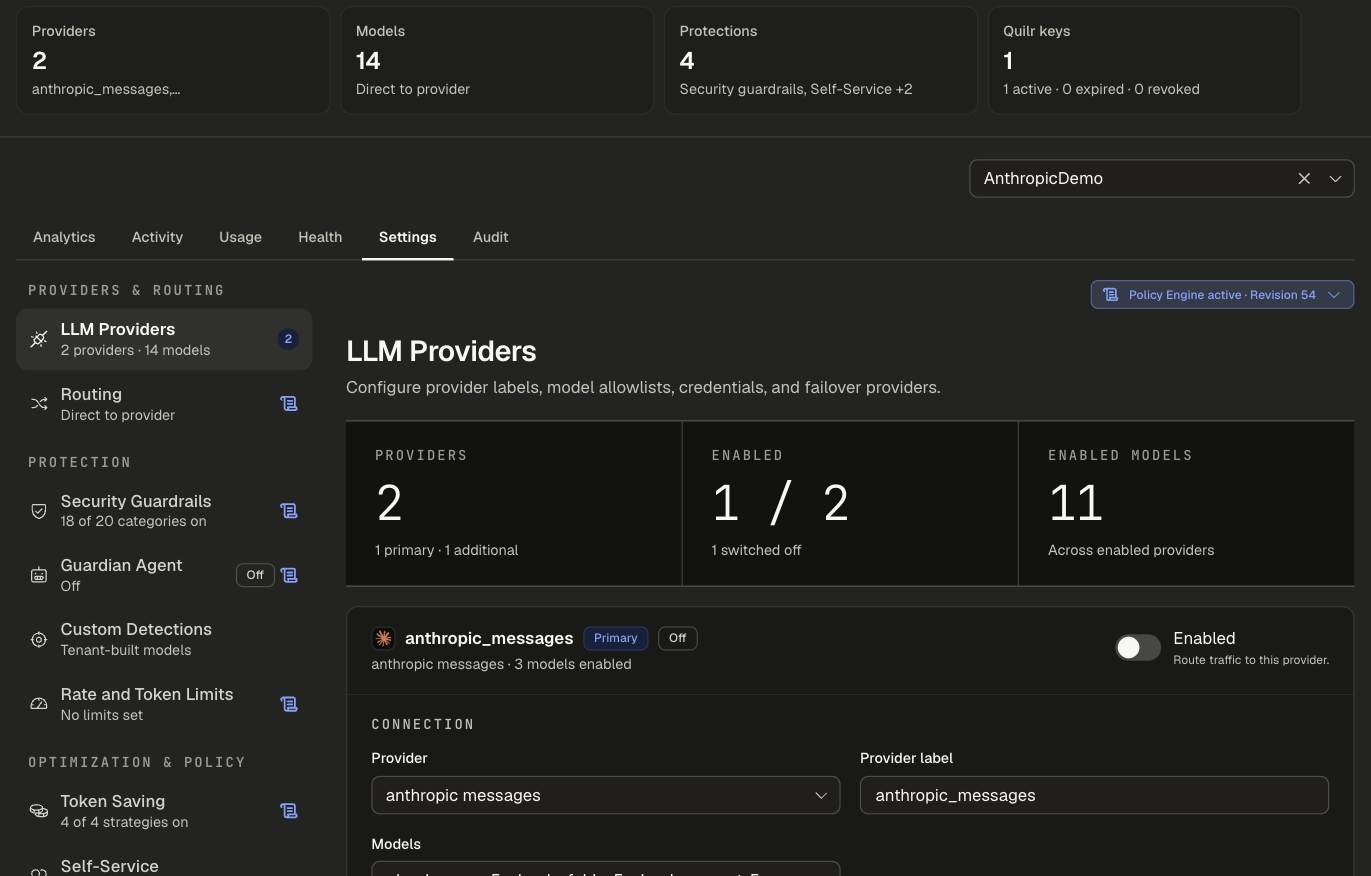
Settings tab of an app with the section list on the left and the LLM Providers section open

GroupSections
Providers & routingLLM Providers, Routing
ProtectionSecurity Guardrails, Guardian Agent, Custom Detections, Rate and Token Limits
Optimization & policyToken Saving, Self-Service, Alerts
Identity & contentIdentity Aware, Prompt Store
OperationsAPI Keys, API Integration and Audit Log
Policy Engine

When the Policy Engine is on, sections marked with its icon (Routing, Security Guardrails, Guardian Agent, Rate and Token Limits, Token Saving, Identity Aware, Prompt Store) follow published policies instead of these settings. Providers, keys and the other sections are still managed here.

Self-service usage​

Self-service usage reports who can view, request changes to, directly edit, see the keys of, and see all logs of each app, and how much they use it. Tabs: Users, Applications, Change history.
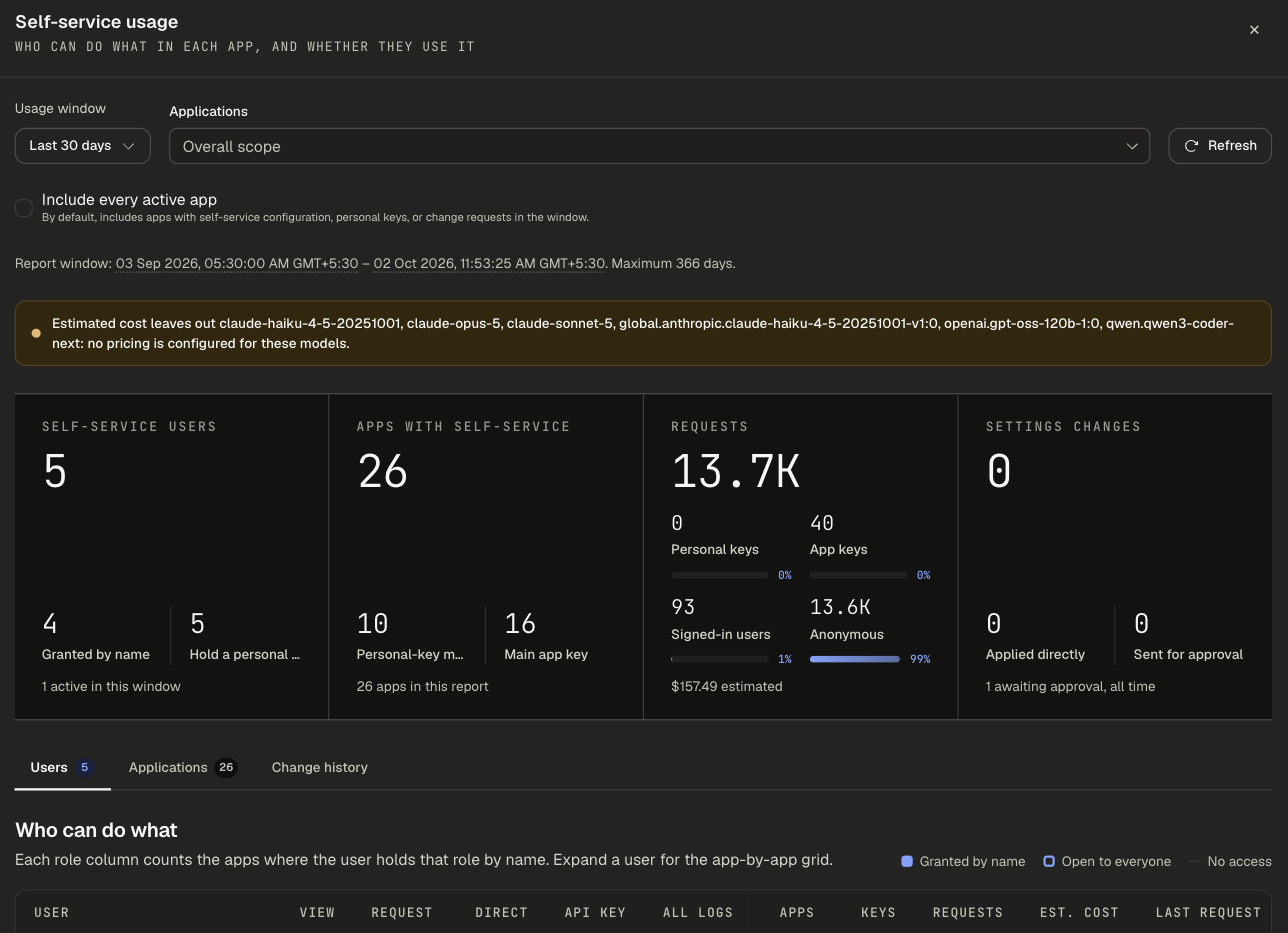
Self-service usage report with user, app, request and settings-change tiles above the Users tab

See Self-Service to set it up.

Next steps​